Using the Skupper network console
The Network console provides data and visualizations of the traffic flow between sites using the Network Observer component which also deploys an API endpoint.
See API documentation for the OpenAPI documentation.
Getting started with Skupper network console
- Helm 3.8 or later
- kubectl access to target Kubernetes cluster
- A Skupper site
Site Selection Criteria
-
Determine which site in your network is best to enable the Network console using the following criteria:
- Does the application network cross a firewall? For example, if you want the console to be available only inside the firewall, you need to locate the Network console on a site inside the firewall.
- Is there a site that processes more traffic than other sites? For example, if you have a frontend component that calls a set of services from other sites, it might make sense to locate the Network console on that site to minimize data traffic.
- Is there a site with more or cheaper resources that you want to use? For example, if you have two sites, A and B, and resources are more expensive on site A, you might want to locate the Network console on site B.
-
Change context to a site namespace.
-
Install with defaults:
-
Access via port-forward:
-
Retrieve the generated password:
Custom Installation
Install with custom values file:
helm install skupper-network-observer \
  oci://quay.io/skupper/helm/network-observer \
--version 2.1.1 \
-f my-values.yaml
Example values file for external access via Ingress:
ingress:
  enabled: true
  className: nginx
  hosts:
    - host: observer.example.com
      paths:
        - path: /
          pathType: Prefix

auth:
  strategy: basic
  basic:
    create: true
OpenShift Route
For OpenShift environments, expose using a Route:
Or use Helm values:
route:
  enabled: true
  subdomain: network-observer

auth:
  strategy: openshift
  openshift:
    createCookieSecret: true
    serviceAccount:
      create: true

tls:
  openshiftIssued: true
Advanced Configuration
The Network Observer Helm chart includes advanced configuration options for Prometheus monitoring, data persistence, metrics collection, authentication strategies, and resource management.
Key features:
- Custom Prometheus configuration — Supply your own
prometheus.ymland process flags - Persistent storage — Store Prometheus time-series data in a PersistentVolumeClaim
- Dedicated metrics endpoint — Separate Service on port 9000 for cluster monitoring tools
- External access — Kubernetes Ingress or OpenShift Route support
- Resource limits — Fine-grained control over CPU and memory
For complete configuration details and examples, see Network Observer Configuration.
Configuration Examples
Persistent Storage
prometheus:
  persistence:
    enabled: true
    storageClass: fast-ssd
    size: 20Gi
  extraArgs:
    - --storage.tsdb.retention.time=30d
    - --storage.tsdb.retention.size=18GB
Custom Prometheus Configuration
prometheus:
  config: |
    global:
      scrape_interval: 30s
      evaluation_interval: 30s
    scrape_configs:
      - job_name: 'network-observer'
        static_configs:
          - targets: ['localhost:8080']
      - job_name: 'my-app'
        static_configs:
          - targets: ['my-app-metrics:9090']
  extraArgs:
    - --storage.tsdb.retention.time=15d
External Access via Ingress
ingress:
  enabled: true
  className: nginx
  annotations:
    cert-manager.io/cluster-issuer: letsencrypt-prod
    nginx.ingress.kubernetes.io/backend-protocol: "HTTPS"
  hosts:
    - host: observer.company.com
      paths:
        - path: /
          pathType: Prefix
  tls:
    - secretName: observer-tls-cert
      hosts:
        - observer.company.com

auth:
  strategy: basic
  basic:
    create: true

tls:
  skupperIssued: true
Resource Limits
containerResources:
  networkObserver:
    requests:
      cpu: 200m
      memory: 512Mi
    limits:
      cpu: 1000m
      memory: 1Gi
  prometheus:
    requests:
      cpu: 500m
      memory: 1Gi
    limits:
      cpu: 2000m
      memory: 4Gi
  proxy:
    requests:
      cpu: 50m
      memory: 64Mi
    limits:
      cpu: 200m
      memory: 256Mi
Observer Tuning
extraArgs:
  - -flow-record-ttl=1h
  - -vanflow-logging-profile=minimal
  - -cors-allow-all  # Development only
Validation and Troubleshooting
Verify Installation
# Check Helm release
helm list

# Check release status
helm status skupper-network-observer

# Get applied values
helm get values skupper-network-observer
Verify Resources
# Check Pods
kubectl get pods -l app.kubernetes.io/name=network-observer

# Check Services
kubectl get svc -l app.kubernetes.io/name=network-observer

# Check Ingress (if enabled)
kubectl get ingress skupper-network-observer

# Check PVC (if persistence enabled)
kubectl get pvc skupper-network-observer-prometheus
Test Metrics Endpoint
kubectl run -it --rm curl --image=curlimages/curl --restart=Never -- \
  curl -sS http://skupper-network-observer-metrics:9000/metrics | head -20
Check Logs
# All containers
kubectl logs deployment/skupper-network-observer --all-containers

# Network Observer container
kubectl logs deployment/skupper-network-observer -c network-observer

# Prometheus container
kubectl logs deployment/skupper-network-observer -c prometheus
Upgrade and Rollback
Upgrade Release
helm upgrade skupper-network-observer \
  oci://quay.io/skupper/helm/network-observer \
  --version 2.1.1 \
  -f my-values.yaml
Check Upgrade History
Rollback to Previous Version
Uninstallation
Uninstall Release
Note: PVCs are NOT deleted automatically. To remove persistent storage:
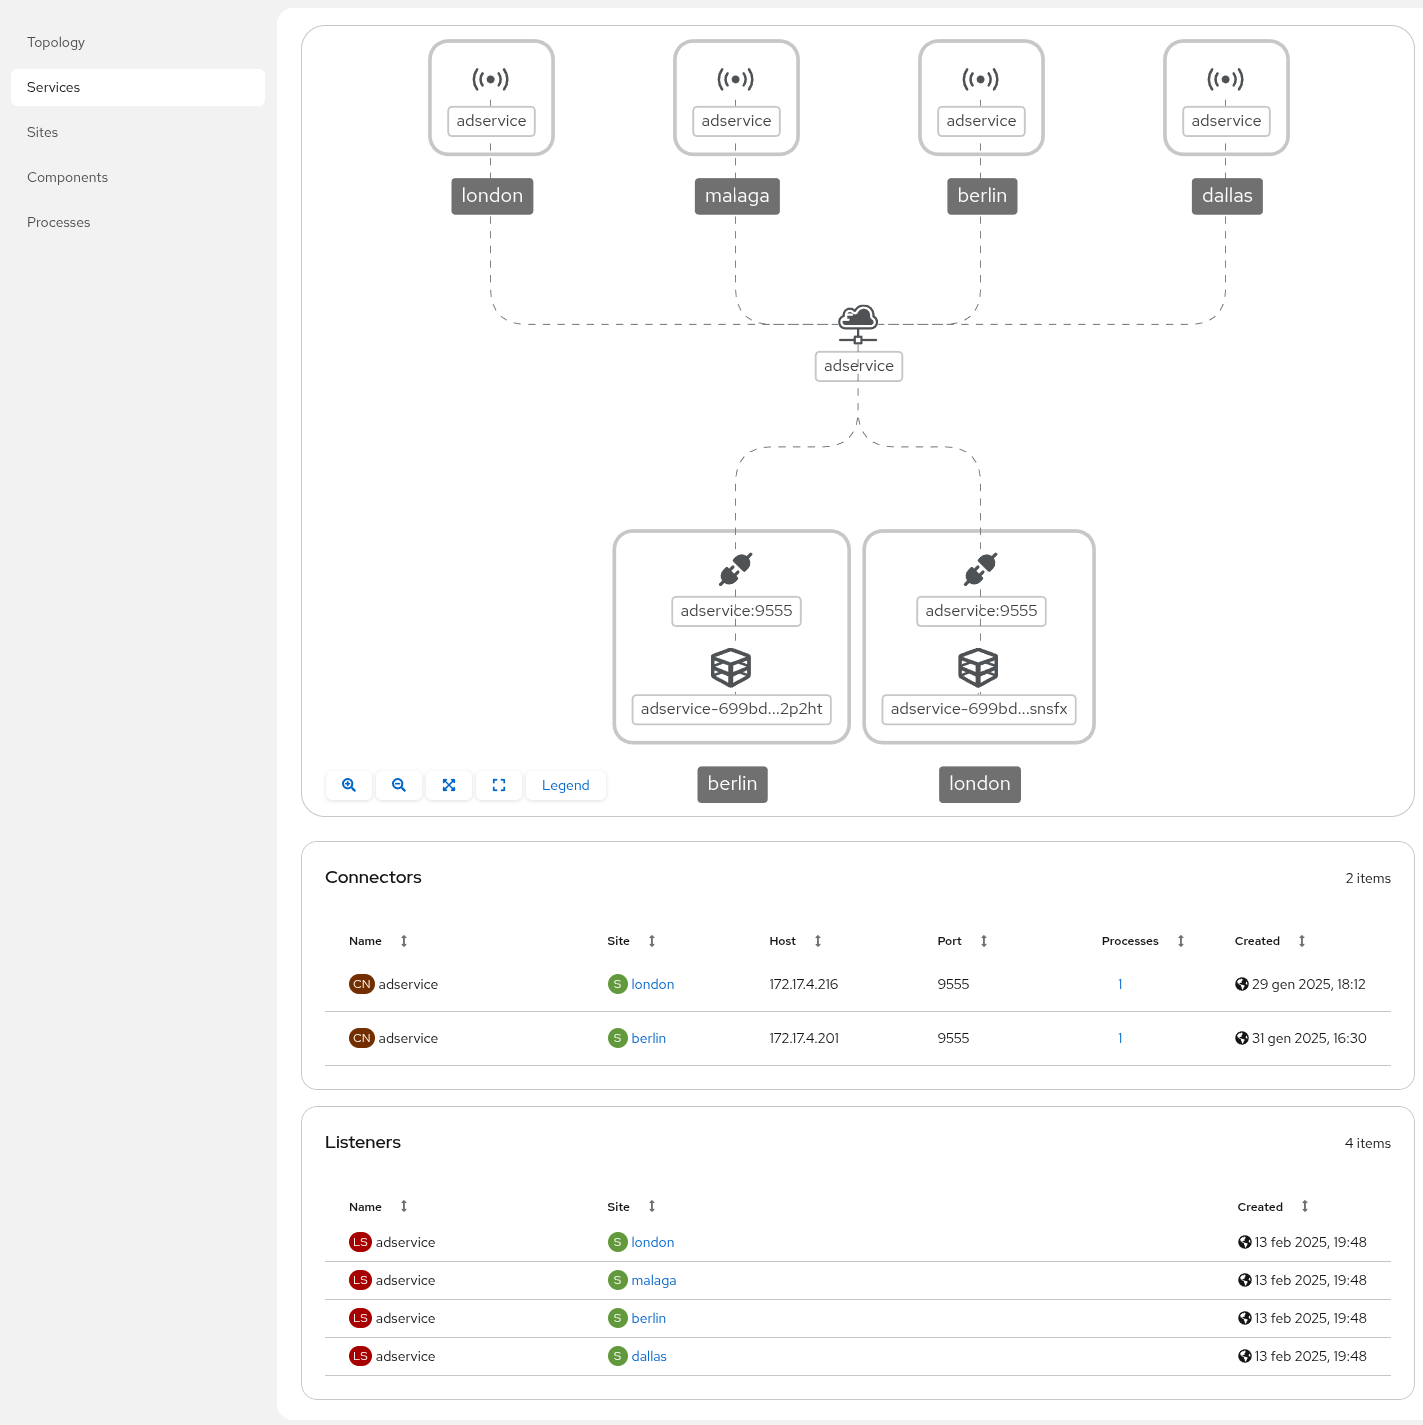
Exploring the Network console
The Network console provides an overview of the following:
- Topology
- Services
- Sites
- Components
- Processes
For example, consider the following service: